Appearance
Data visualization
One entity per data row, plus a scripted camera track and a render test.
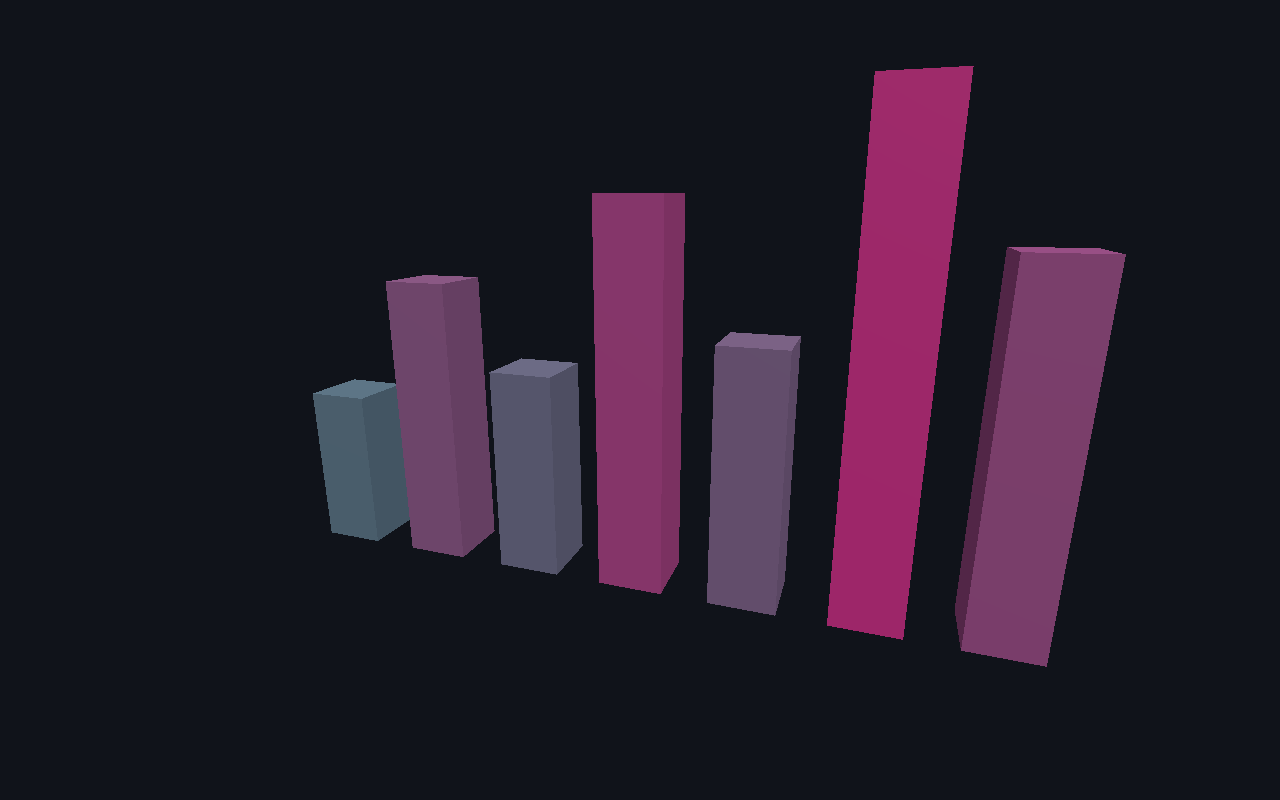
Shows the engine used for something other than a game: a JSON dataset becomes entities, and a molen/cameratrack@1 document flies the camera along a keyframed path. The golden test renders a frame headlessly and compares it to a committed PNG.
Play it
Play Data visualization in your browser. Nothing to install.
Make it yours
The sample ships inside @bendyline/molen-tooling as a template, locked to the engine version you install. Copy it into a standalone npm project (no clone of the engine repository needed):
sh
npx @bendyline/molen-tooling new my-data-viz --template data-viz
cd my-data-viz
npm install
npm run dev
The copy keeps the sample's scene, scripts, commands, checks and headless tests; npm test runs them.
What it teaches
- Data-driven entities
- Camera tracks
- Render tests
The scene at a glance
Read straight out of the sample's scene.json:
| Format | molen/scene@3 |
| Tick rate | 30 Hz |
| Entities | 0 |
| Prefabs | 0 |
| Scene scripts | — |
| Commands | — |
| Declares | — |
Run it headlessly
Every sample is also a headless fixture, so no browser is needed. From your copy:
sh
npx molen validate scene.json
npx molen sim run scene.json --ticks 60 --hash
npx molen shot scene.json --ticks 60 --out data-viz.png
Source
examples/data-viz. A walkthrough README ships alongside it and in every copy.